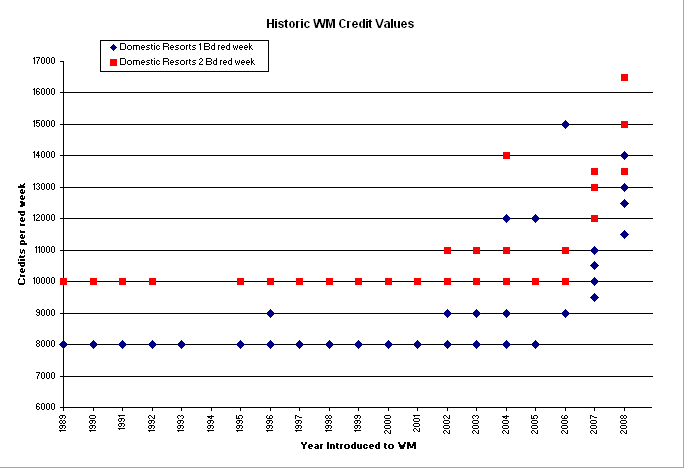
Historic Credit Values
Here is a look at the historic trends in credit values over time, both in table format and in graphic format. Note that this ONLY addresses the assigned credit value of a "red week". I have not addressed the trend toward more red weeks and fewer white/blue weeks per year, nor the shrinking distinction between the credit value assignments for the seasons. (In other words: it's worse than it looks here!)
| Resort | Year Acquired | Red 1 Bd | Red 2 Bd |
|---|---|---|---|
| Eagle Crest | 1989 | 10,000 | 8,000 |
| Birch Bay | 1990 | 10,000 | 8,000 |
| Lake Chelan | 1990 | 10,000 | 8,000 |
| Mariner Village | 1990 | 10,000 | 8,000 |
| Discovery Bay | 1991 | 10,000 | n/a |
| Surfside | 1991 | 10,000 | 8,000 |
| Tahoe I/II/III | 1991 | 10,000 | 8,000 |
| Leavenworth | 1992 | 10,000 | n/a |
| Sundance | 1992 | 10,000 | 8,000 |
| Pismo Beach | 1993 | n/a | 8,000 |
| Gleneden | 1995 | 10,000 | 8,000 |
| Palm Springs | 1995 | 10,000 | 8,000 |
| Bass Lake | 1996 | 10,000 | 8,000 |
| Big Bear | 1996 | 10,000 | 8,000 |
| Running Y | 1996 | 10,000 | 9,000 |
| Cascade Lodge | 1997 | n/a | 8,000 |
| Clear Lake | 1997 | 10,000 | 8,000 |
| LV/Spencer St. | 1997 | 10,000 | 8,000 |
| Schooner Landing | 1997 | 10,000 | 8,000 |
| Angels Camp | 1998 | 10,000 | 8,000 |
| Depoe Bay | 1998 | 10,000 | 8,000 |
| Wolf Creek | 1998 | 10,000 | 8,000 |
| Bear Lake | 1999 | 10,000 | 8,000 |
| Marina Dunes | 1999 | 10,000 | n/a |
| Pinetop | 1999 | 10,000 | 8,000 |
| Rancho Vistoso | 1999 | 10,000 | 8,000 |
| The Canadian | 1999 | 10,000 | 8,000 |
| Arrow Point | 2000 | 10,000 | n/a |
| Bison Ranch | 2000 | 10,000 | 8,000 |
| Branson | 2000 | 10,000 | 8,000 |
| La Paloma | 2000 | 10,000 | 8,000 |
| Lake/Ozarks | 2000 | 10,000 | 8,000 |
| Reno | 2000 | 10,000 | 8,000 |
| St. George | 2000 | 10,000 | 8,000 |
| Steamboat | 2000 | 10,000 | 8,000 |
| McCall | 2001 | 10,000 | n/a |
| Oceanside | 2001 | 10,000 | 8,000 |
| LV Blvd | 2002 | 11,000 | 9,000 |
| South Shore | 2002 | 10,000 | 8,000 |
| Galena | 2003 | 10,000 | 8,000 |
| Grand Lake | 2003 | 10,000 | 8,000 |
| Orlando | 2003 | 11,000 | 9,000 |
| Seaside | 2003 | 10,000 | 8,000 |
| Victoria | 2003 | 10,000 | n/a |
| Windsor | 2003 | 10,000 | 8,000 |
| Camlin | 2004 | 14,000 | 12,000 |
| Dolphin's Cove | 2004 | 10,000 | 8,000 |
| Estes Park | 2004 | 11,000 | 8,000 |
| Ocean Walk | 2004 | 11,000 | 9,000 |
| San Francisco | 2004 | n/a | 12,000 |
| New Orleans | 2005 | n/a | 12,000 |
| Solvang | 2005 | 10,000 | 8,000 |
| Indio | 2006 | 11,000 | 9,000 |
| Midway | 2006 | 10,000 | n/a |
| San Diego | 2006 | n/a | 15,000 |
| Canmore | 2007 | 12,000 | 10,000 |
| LV/Tropicana | 2007 | 13,000 | 10,500 |
| Red River | 2007 | 12,000 | 9,500 |
| W. Yellowstone | 2007 | 13,500 | 11,000 |
| Mission Valley | 2008 | 15,000 | 12,500 |
| Anaheim | 2008 | 16,500 | 14,000 |
| Santa Fe | 2008 | n/a | 14,000 |
| Taos | 2008 | 15,000 | 13,000 |
| New Braunfels | 2008 | 13,500 | n/a |
| Long Beach | 2008 | 13,500 | 11,500 |